36
Group financial review (continued)
Ahold at a glance
Business review
Governance
Ahold
Annual Report 2014
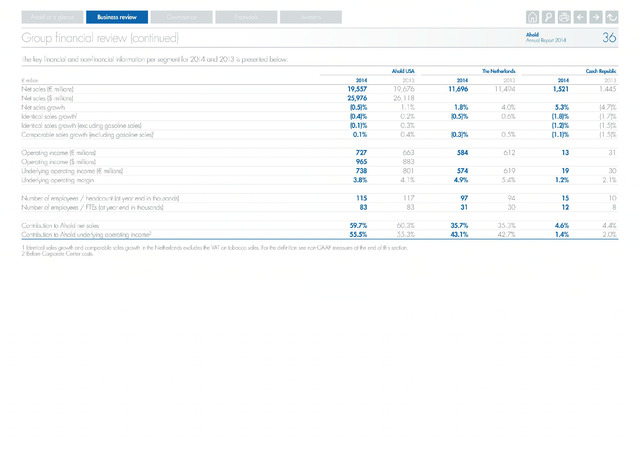
The key financial and non-financial information per segment for 2014 and 2013 is presented below:
Ahold USA
The Netherlands
Czech Republic
millior
2014
2013
2014
2013
2014
2013
Net sales millions)
19,557
19,676
11,696
11,494
1,521
1,445
Net sales millions)
25,976
26,118
Net sales growth
(0.5)%
1.1%
1.8%
4.0%
5.3%
(4.7)%
Identical sales growth1
(0.4)%
0.2%
(0.5)%
0.6%
(1.8)%
(1.7)%
Identical sales growth (excluding gasoline sales)
(0.1)%
0.3%
(1.2)%
(1.5)%
Comparable sales growth (excluding gasoline sales)1
0.1%
0.4%
(0.3)%
0.5%
(1.1)%
(1.5)%
Operating income millions)
727
663
584
612
13
31
Operating income millions)
965
883
Underlying operating income millions)
738
801
574
619
19
30
Underlying operating margin
3.8%
4.1%
4.9%
5.4%
1.2%
2.1%
Number of employees headcount (at year end in thousands)
115
117
97
94
15
10
Number of employees FTEs (at year end in thousands)
83
83
31
30
12
8
Contribution to Ahold net sales 59.7% 60.3% 35.7% 35.3% 4.6% 4.4%
Contribution to Ahold underlying operating income2 55.5% 55.3% 43.1% 42.7% 1.4% 2.0%
1 Identical sales growth and comparable sales growth in the Netherlands excludes the VAT on tobacco sales. For the definition see non-GAAP measures at the end of this section.
2 Before Corporate Center costs.