H
178
Five-year
overview
Ahold at a glance
Our strategy
Our performance
Governan
Finan
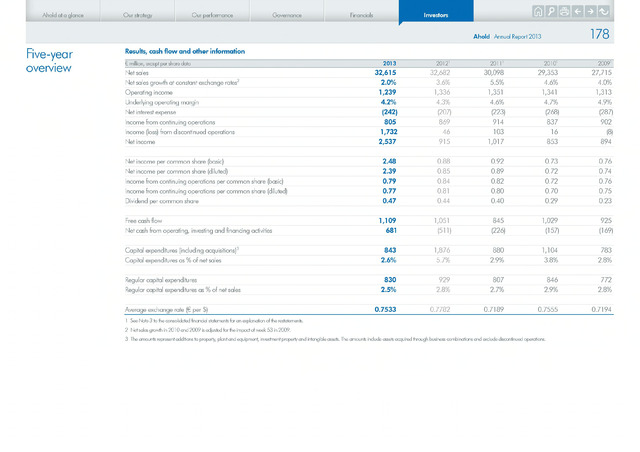
Results, cash flow and other information
million, except per share data
Net sales
Net sales growth at constant exchange rates2
Operating income
Underlying operating margin
Net interest expense
Income from continuing operations
Income (loss) from discontinued operations
Net income
nvestors
Ahold Annual Report 2013
2013
2012'
2011'
32,615
2.0%
1,239
4.2%
(242)
805
1,732
2,537
32,682
3.6%
1,336
4.3%
(207)
869
46
915
30,098
5.5%
1,351
4.6%
(223)
914
103
1,017
20101
29,353
4.6%
1,341
4.7%
(268)
837
16
853
20091
27,715
4.0%
1,313
4.9%
(287)
902
(8)
894
Net income per common share (basic) 2.48 0.88 0.92 0.73 0.76
Net income per common share (diluted)
2.39
0.85
0.89
0.72
0.74
Income from continuing operations per common share (basic)
0.79
0.84
0.82
0.72
0.76
Income from continuing operations per common share (diluted)
0.77
0.81
0.80
0.70
0.75
Dividend per common share 0.47 0.44 0.40 0.29 0.23
Free cash flow 1,109 1,051 845 1,029 925
Net cash from operating, investing and financing activities
681
(511)
(226)
(157)
(169)
Capital expenditures (including acquisitions)3
843
1,876
880
1,104
783
Capital expenditures as of net sales
2.6%
5.7%
2.9%
3.8%
2.8%
Regular capital expenditures
830
929
807
846
772
Regular capital expenditures as of net sales 2.5% 2.8% 2.7% 2.9% 2.8%
Average exchange rate per 0.7533 0.7782 0.7189 0.7555 0.7194
1 See Note 3 to the consolidated financial statements for an explanation of the restatements.
2 Net sales growth in 2010 and 2009 is adjusted for the impact of week 53 in 2009.
3 The amounts represent additions to property, plant and equipment, investment property and intangible assets. The amounts include assets acquired through business combinations and exclude discontinued operations.