H
KÜ1I3E3
imiiberi
45
Financial review (continued)
Ahold at a glance Our strategy
Our performance
Governan
Financials
Investors
Ahold Annual Report 2013
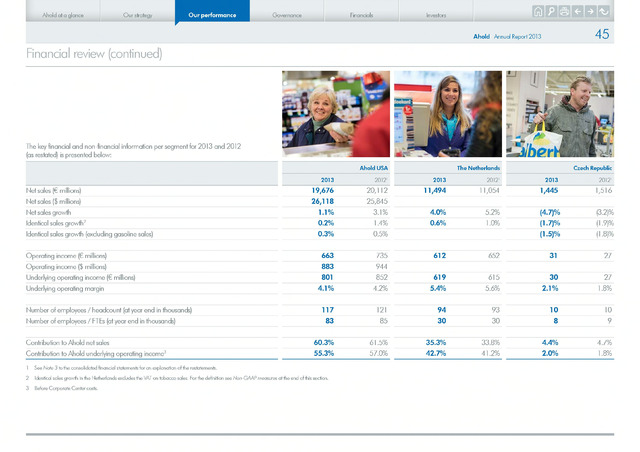
The key financial and non-financial information per segment for 2013 and 2012
(as restated) is presented below:
Ahold USA
The Netherlands
Czech Republic
2013
20121
2013
20121
2013
20121
Net sales millions)
19,676
20,112
11,494
11,054
1,445
1,516
Net sales millions)
26,118
25,845
Net sales growth
1.1%
3.1%
4.0%
5.2%
(4.7)%
(3.2)%
Identical sales growth2
0.2%
1.4%
0.6%
1.0%
(1.7)%
(1.9)%
Identical sales growth (excluding gasoline sales)
0.3%
0.5%
(1.5)%
(1.8)%
Operating income millions)
663
735
612
652
31
27
Operating income millions)
883
944
Underlying operating income millions)
801
852
619
615
30
27
Underlying operating margin
4.1%
4.2%
5.4%
5.6%
2.1%
1.8%
Number of employees headcount (at year end in thousands)
117
121
94
93
10
10
Number of employees FTEs (at year end in thousands)
83
85
30
30
8
9
Contribution to Ahold net sales
60.3%
61.5%
35.3%
33.8%
4.4%
4.7%
Contribution to Ahold underlying operating income3
55.3%
57.0%
42.7%
41.2%
2.0%
1.8%
1 See Note 3 to the consolidated financial statements for an explanation of the restatements.
2 Identical sales growth in the Netherlands excludes the VAT on tobacco sales. For the definition see Non-GAAP measures at the end of this section.
3 Before Corporate Center costs.