H
HaEl
□I
37
Financial review
Net sales
Ahold at a glance Our strategy
Our performance
Governan
Financials
Investors
Ahold Annual Report 2013
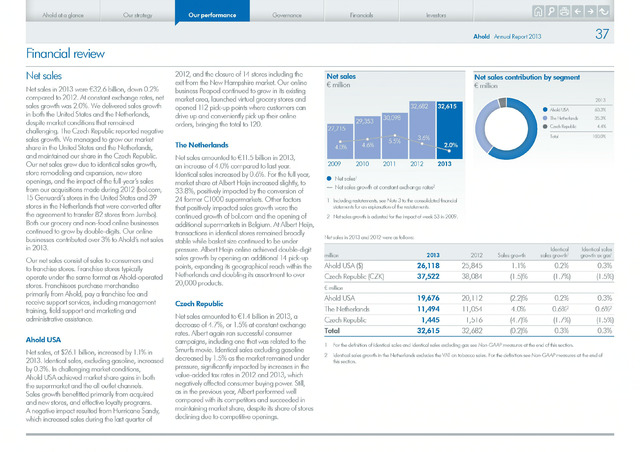
Net sales in 2013 were €32.6 billion, down 0.2%
compared to 2012. At constant exchange rates, net
sales growth was 2.0%. We delivered sales growth
in both the United States and the Netherlands,
despite market conditions that remained
challenging. The Czech Republic reported negative
sales growth. We managed to grow our market
share in the United States and the Netherlands,
and maintained our share in the Czech Republic.
Our net sales grew due to identical sales growth,
store remodeling and expansion, new store
openings, and the impact of the full-year's sales
from our acquisitions made during 2012 (bol.com,
15 Genuardi's stores in the United States and 39
stores in the Netherlands that were converted after
the agreement to transfer 82 stores from Jumbo).
Both our grocery and non-food online businesses
continued to grow by double-digits. Our online
businesses contributed over 3% to Ahold's net sales
in 2013.
Our net sales consist of sales to consumers and
to franchise stores. Franchise stores typically
operate under the same format as Ahold-operated
stores. Franchisees purchase merchandise
primarily from Ahold, pay a franchise fee and
receive support services, including management
training, field support and marketing and
administrative assistance.
Ahold USA
Net sales, at $26.1 billion, increased by 1.1% in
2013. Identical sales, excluding gasoline, increased
by 0.3%. In challenging market conditions,
Ahold USA achieved market share gains in both
the supermarket and the all outlet channels.
Sales growth benefitted primarily from acquired
and new stores, and effective loyalty programs.
A negative impact resulted from Hurricane Sandy,
which increased sales during the last quarter of
2012, and the closure of 14 stores including the
exit from the New Hampshire market. Our online
business Peapod continued to grow in its existing
market area, launched virtual grocery stores and
opened 112 pick-up points where customers can
drive up and conveniently pick up their online
orders, bringing the total to 120.
The Netherlands
Net sales amounted to €11.5 billion in 2013,
an increase of 4.0% compared to last year.
Identical sales increased by 0.6%. For the full year,
market share at Albert Heijn increased slightly, to
33.8%, positively impacted by the conversion of
24 former C1000 supermarkets. Other factors
that positively impacted sales growth were the
continued growth of bol.com and the opening of
additional supermarkets in Belgium. At Albert Heijn,
transactions in identical stores remained broadly
stable while basket size continued to be under
pressure. Albert Heijn online achieved double-digit
sales growth by opening an additional 14 pick-up
points, expanding its geographical reach within the
Netherlands and doubling its assortment to over
20,000 products.
Czech Republic
Net sales amounted to €1.4 billion in 2013, a
decrease of 4.7%, or 1.5% at constant exchange
rates. Albert again ran successful consumer
campaigns, including one that was related to the
Smurfs movie. Identical sales excluding gasoline
decreased by 1.5% as the market remained under
pressure, significantly impacted by increases in the
value-added tax rates in 2012 and 2013, which
negatively affected consumer buying power. Still,
as in the previous year, Albert performed well
compared with its competitors and succeeded in
maintaining market share, despite its share of stores
declining due to competitive openings.
Net sales
Net sales contribution by segment
32,682
32,615
30,098
29,353^
27,715
5.5%
3.6%
4.0%
2.0%
4.6%
Ahold USA
The Netherlands
Czech Republic
Total
2009
2010
2011
2012
2013
Net sales1
Net sales growth at constant exchange rates2
1 Including restatements, see Note 3 to the consolidated financial
statements for an explanation of the restatements.
2 Net sales growth is adjusted for the impact cf week 53 in 2009.
Net sales in 2013 and 2012 were as follows:
million
2013
2012
Sales growth
Identical
sales growth1
Identical sales
growth ex gas1
Ahold USA
26,118
25,845
1.1%
0.2%
0.3%
Czech Republic (CZK)
37,522
38,084
(1.5)%
(1.7%)
(1.5%)
million
Ahold USA
19,676
20,112
(2.2)%
0.2%
0.3%
The Netherlands
11,494
11,054
4.0%
0.6%2
0.6%2
Czech Republic
1,445
1,516
(4.7)%
(1.7%)
(1.5%)
Total
32,615
32,682
(0.2)%
0.3%
0.3%
1 For the definition of identical sales and identical sales excluding gas see Non-GAAP measures at the end of this section.
2 Identical sales growth in the Netherlands excludes the VAT on tobacco sales. For the definition see Non-GAAP measures at the end of
this section.