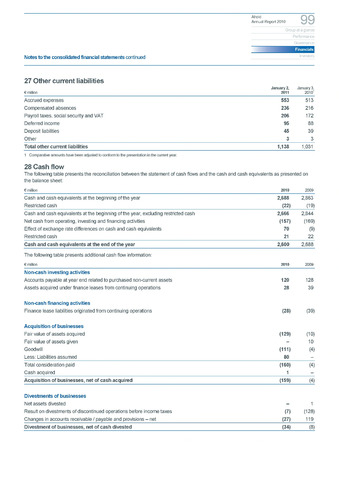
27 Other current liabilities
28 Cash flow
-
-
-
-
Ahold
Annual Report 2010
Group at a glance
Performance
Governance
Financials
Notes to the consolidated financial statements continued
Investors
January 2,
January 3,
million
2011
20101
Accrued expenses
553
513
Compensated absences
236
216
Payroll taxes, social security and VAT
206
172
Deferred income
95
88
Deposit liabilities
45
39
Other
3
3
Total other current liabilities
1,138
1,031
1 Comparative amounts have been adjusted to conform to the presentation in the current year.
The following table presents the reconciliation between the statement of cash flows and the cash and cash equivalents as presented on
the balance sheet:
million
2010
2009
Cash and cash equivalents at the beginning of the year
2,688
2,863
Restricted cash
(22)
(19)
Cash and cash equivalents at the beginning of the year, excluding restricted cash
2,666
2,844
Net cash from operating, investing and financing activities
(157)
(169)
Effect of exchange rate differences on cash and cash equivalents
70
(9)
Restricted cash
21
22
Cash and cash equivalents at the end of the year
2,600
2,688
The following table presents additional cash flow information:
million
2010
2009
Non-cash investing activities
Accounts payable at year end related to purchased non-current assets
120
128
Assets acquired under finance leases from continuing operations
28
39
Non-cash financing activities
Finance lease liabilities originated from continuing operations
(28)
(39)
Acquisition of businesses
Fair value of assets acquired
(129)
(10)
Fair value of assets given
10
Goodwill
(111)
(4)
Less: Liabilities assumed
80
Total consideration paid
(160)
(4)
Cash acquired
1
Acquisition of businesses, net of cash acquired
(159)
(4)
Divestments of businesses
Net assets divested
1
Result on divestments of discontinued operations before income taxes
(7)
(128)
Changes in accounts receivable payable and provisions - net
(27)
119
Divestment of businesses, net of cash divested
(34)
(8)